Conditioning data, an essential step in the value chain of Digital Transformation.
Keywords
Data conditioning, digital transformation, infonomics, dataset, data reconciliation, data validation, data filtration, advanced analytics
Abstract
Conditioning materials according to the processing capability of a production facility is an essential step in many process industries dealing with natural resources. This concept has yet another relevant application within the plant operations ecosystem: “data conditioning.” Data conditioning is a critical part of the digital transformation of the data resource. It is revolutionizing plant operations and impacting knowledge workers, business processes and systems across the organization and the value chain. In this presentation, we will discuss strategies, benefits and concrete actions that can be taken to ensure that process data and information are ready for business use and can support advanced manufacturing strategies, digital transformation initiatives and advanced analytics.
Introduction
Today, digital transformation is on everybody’s minds, as evidenced by the significant uptick in interest in “digital transformation” keywords compiled by the Google trend service (see Figure 1). Indeed, digital transformation is giving rise to new projects, initiatives, enterprise strategies, job positions, apps, companies, business models, etc. Furthermore, digital transformation is forcing IT and OT to come together to develop action plans that link operational data to strategic operational and business outcomes.
Process industry professionals are no stranger to this phenomenon. If we define digital transformation as “the use of digital technology to rethink how we solve problems by reducing our dependence on hardware and improving the outcome of a given process or operations,” the advent of the DCS[a] would qualify as a digital transformation. Process historians would also qualify. The work of OPC[b] foundation would, as well.
So, what is different about today? The difference between 1980 and today lies in the subject of digital transformation itself (See Figure 2). In the early days of digital transformation, digital technology was used to “digitize” the electro-mechanical-pneumatic world we lived in. The process was data (measurement) centric and an important first step.
Digitization created the need for data repositories (“databases”) to manage this new data resource. Digital assets were born. Process historians and relational database technologies evolved rapidly during this period and became unavoidable infrastructure investments.
As a result, these systems accumulated large quantities of data and events, some with high temporal resolution across a broad, diversified spectrum of data types. This accumulation contributed to the rise of the concept of “Big Data,”[c] considered hype by some and hope by others. The industry also referred to this abundance of data using extreme metaphors like “Data Eruption” or “Data Tsunami.” Not long ago, The Economist, amongst others, called “Data” the new “Oil.”[1] Today, we have expanded the concept to “Data Lake.”
Regardless of the metaphor, the result is an abundance of data and an abundance of opportunities to create value. Both are fueling the current digital transformation era.
Digital transformation is now the main driver for changes in the process and manufacturing industries and has become the main innovation challenge for engineers and scientists, as well as OT and IT professionals. Digital transformation initiatives based on data (Big Data, Advanced Analytics and AI), represent about 50%[2] of industry initiatives, illustrating their significance.
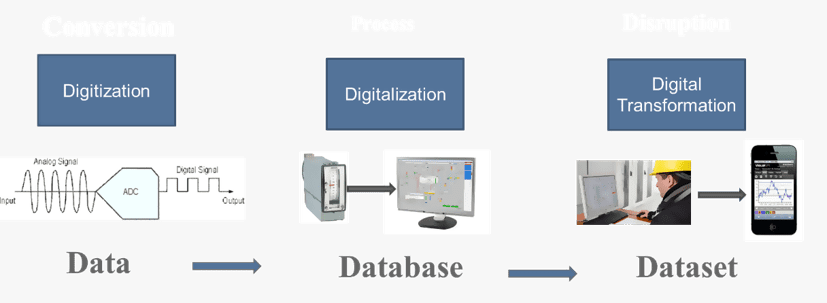
Figure 1 – From data to dataset
Data-centric digital transformation initiatives all have one thing in common. They require we deal with data quality issues and render the data usable by assembling it into datasets (See Figure 1 again) relevant to the digital transformation initiative. We also need to repeat and sustain this process in a real-time manufacturing environment. This overall process, which we call “Data Conditioning,” is the subject of this paper.
Data Conditioning
We consider data conditioning to be an essential predecessor step in virtually every data-driven digital transformation initiative because of the inherent precision limitations of measurement systems, the uncontrollable or unpredictable occurrence of data defects (See Table 1), the necessity of building a coherent dataset for analysis, and the recurrent nature of this process, which needs to be conducted with minimal human vigilance and without it when possible.
| - Calibration Error | - Network Error | - Missing Data | - UOM[d] Error |
| - Calculation Error | - Meter Out of Service | - Data Corruption | - Manual Data Entry Error |
| - I/O Configuration Error | - I/O Time Out | - Defective Sensor | - Out of Calibration |
| - Corrupted Index | - Data Loss | - Flatlining | - Inconsistent Time Shift |
| - Data Type Mismatch |
Table 1 – List of common data defects
In the absence of data conditioning, advanced analytics and data science projects become crippled and less likely to yield their benefits. We will demonstrate that data conditioning is a simple, practical, cost effective and proven method of improving the outcome of digital transformation initiatives.
The definition of conditioning is to bring something into a desired state of use. This is a common step in processing industries and is usually associated with the preparation of raw materials so they can be processed efficiently by equipment or a process unit. Examples of conditioning activities are desalting, desulphurizing, filtration, and dehumidification. Another characteristic of conditioning operations is being defined by a known objective. Without knowledge of the objective, it is not possible to design a conditioning strategy.
When it comes to data-centric digital transformation initiatives, the analogy holds. Digital transformation initiatives are tied to specific goals and objectives which are tied to a business or operational outcome involving direct or indirect monetization. The emerging field of Infonomics[3] is also driving the transformation of data and information into digital assets. Examples of objectives and goals include: increasing equipment reliability; identifying failure modes and predicting failure; predicting quality with more accuracy; tracking costs with more accuracy; reducing utilities consumption and losses; and increasing saleable yield.
The raw material of digital transformation is data. Raw data, like raw materials in process industries, are unlikely to be directly usable as the bulk of it was collected in a process historian or other database type without prior knowledge of the future use. Therefore, the time resolution is likely off, the engineering units are different than the ones needed, pressure and temperature compensation may not have been applied, a variety of data defects will be present, there is inherent bias associated with the measurement systems, etc. Furthermore, most initiatives require the assembly of a dataset spanning multiple data sources.
In all, we have identified six different task groups, activities or tactics which can contribute to the overall Data Conditioning journey, and two major phases of the Data Conditioning lifecycle.
- Phase 1 – From raw data to cleansed data – represents all the tasks that can be executed at the time of acquisition (near real-time) or thereafter and do not require a data model;
- Phase 2 – From cleansed data to reconciled data – represents the tasks that will further enhance data quality through the application of a data model and an iterative error-minimization algorithm.
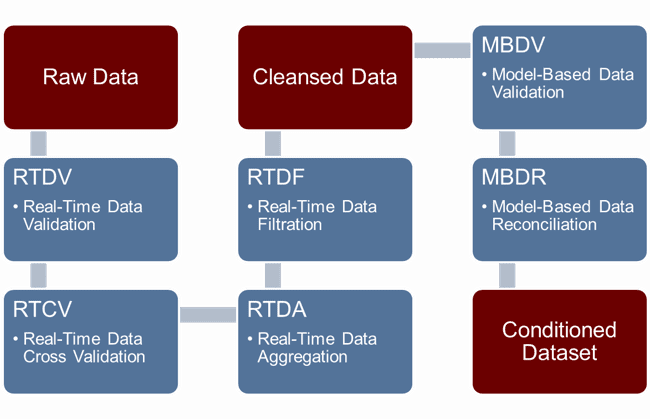
Figure 2 – Data conditioning steps
Phase 1 – Data Cleansing
Data cleansing can be accomplished through the following four (4) activities:
- Real-Time Data Validation (RTDV)[4] – deals with most common data defects which can be detected at the time of acquisition (e.g. out of range, I/O time out, flatline, etc.). The data defect detection capabilities are a combination of the capabilities of the control system and the rules configured in the process data historian.
Data validation rules can also rely on temporal redundancy (stepping back in time) to assess the validity of a given current value. While RTDV is feasible and a common practice, it is not always fully implemented, resulting in the accumulation of data defects impacting the usability of data for digital transformation initiatives. The more fundamental issue with RTDV is implementing corrective actions to prevent reoccurrence of the defects, which has proven to be a challenging task reserved for critical measurements only.
- Real-Time Cross Validation (RTCV) – leverages a known relationship between a given data point and other associated data points to infer a more accurate value. Examples are temperature and pressure compensation for fluids, flow adjustment based on a density probe reading, etc. RTCV is based on deterministic equations. It can also fall victim to the data defects described above which can be addressed by model-based data reconciliation (discussed later).
- Real-Time Data Aggregation (RTDA) – uses the real-time calculation capabilities of systems to create aggregates of raw data or calculated data points like moving averages, totalizers, min/max, etc. These aggregations are useful because they help transform raw data into immediately usable information. However, such aggregates can also fall victim to the basic data defects outlined above.
- Real-Time Data Filtration (RTDF) – finally, using filters can also be part of the Data Conditioning strategy for noisy measurements or short Data Conditioning windows (minutes vs. hours or days). The goal of RTDF is to remove unnecessary data like outliers, values and rate of changes that are physically not possible, etc.
These first four (4) steps can usually be implemented in the data collection infrastructure, be it in the process control system, the process historian, or both. The quality of cleansed data available for the next phase will be determined by the extent to which these conditioning steps were carried out. The resulting “cleansed data” becomes the input to the next phase.
While RTDV is used to some degree in almost all cases, the other activities (RTDA, RTCV and RTDF) are not.
Phase 2 – Data Reconciliation
The next steps in the data conditioning journey involve cross validation between datapoints using a model describing the relationship between the measurements, integrating the objective(s) of the digital transformation initiative through an objective function, and solving the model for minimum variance.
The model creation requires a front-end effort to create a digital “PFD[e] equivalent” data flow diagram (model) defining how the process measurements are related to one another for a given process envelope, one or many circuits (product, utilities, energy, etc.) inside this envelope, and a constraint we can apply on the dataset to reduce the overall imbalance or variance.
The model also describes how additional external information elements like Standards (API, ASTM, etc.), thermodynamic principles, laboratory and process analyzer results, product grades, product specifications, manual entries, etc. are related. The benefit of this model is the introduction of broader spatial redundancy, which can then be used to reduce the overall variance of the dataset.
Finally, from the model, we can generate an over-dimensioned set of equations to which a combination of numerical and statistical methods can be applied to produce a set that minimizes the discrepancy between raw data and the final solution.[5]
Once the model is built, we can use it iteratively to continue our data conditioning journey with the following activities:
- Model-Based Data Validation (MBDV) – the first step in the model-based data validation is to address gross errors and data defects that would render the model unusable. The model also enables the application of deterministic equations which have dependencies on external data and out-of-order data (laboratory results, manual entries), complex equations, and algorithms which cannot be supported or applied in the real-time data infrastructure. The goal of this step is to ensure the dataset is reconcilable and maximizes the information that can be extracted from the cleansed data using engineering principles, empirical rules and elements of operational intelligence that are known and considered valid or proven.
- Model-Based Data Reconciliation (MBDR) – this final step involves an iterative process where the measurements, which are subject to biases in the model, are solved for minimum variance and a reconciled dataset is generated. When this approach is used to create a generalized dataset, like plant-wide material balance, energy balance, metallurgical balance, etc., used primarily for reporting, we refer to the dataset as a “Reconciled Dataset.” However, when the model is purposely designed for a specific digital transformation outcome, we refer to it as a “Conditioned Dataset.” The frequency at which this process is repeated is a function of the dynamic of the digital transformation initiative and depends on how much computer power one is willing to apply. It typically ranges from minutes (15, 30) to hours.
In the case of digital transformation, models are more dynamic and therefore subject to modification. They should evolve in response to the digital transformation results and lifecycle. The model may also be applied retroactively to reprocess historical data for testing purposes.
Besides its direct benefit, MBDR provides two (2) important additional advantages:
- The model in MBDR becomes the dataset definition and can integrate the data collection rules which can be run on schedule or on event and contribute to minimizing the human vigilance required for the continuous generation of a conditioned dataset in a real-time manufacturing environment;
- MBDR also generates data quality Key Performance Indicators (KPIs) which can be used to facilitate the identification of recurring data defects (Corrected in Phase 1) and provide a path to the determination of the root cause so these defects are minimized over time.
The tangible outcome of this Data Conditioning journey is the capability and ability to sustain the generation of cleansed data and reconciled datasets, where the uncertainty of the data has been minimized to the fullest extent possible in order to identify data defects as they occur and generate prescriptive actions to maintain and improve data quality over time.
Example
To illustrate the concept, we will use a common and relatively simple process operation: the preheating of crude oil in a tubular furnace. Our goal is to improve the measurement of the combustion efficiency by estimating a reliable value for the excess oxygen (O2) and use this information to operate the furnace more efficiently. This will reduce the energy consumption and minimize carbon dioxide (CO2) emissions.
Figure 3 shows the results we get when using data as measured by sensors (raw data) and attempt to correlate the combustion efficiency with the measured O2. We observe that the correlation is poor and the data is not usable for our purpose.
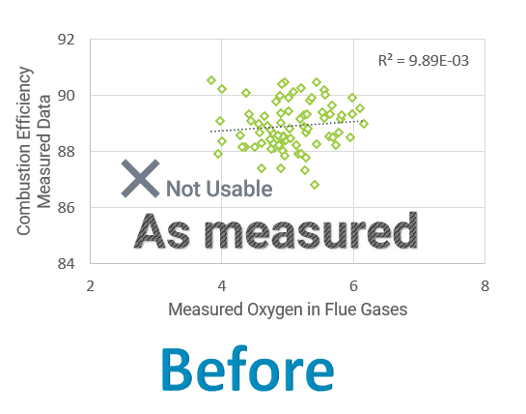
Figure 3 – Estimating excess O2 using data as measured
Applying data conditioning to the same dataset yields a much different result (Figure 4). The correlation emerges from the data. In this example, raw data have been conditioned and turned into a digital asset that can now be used to drive improvements.[f]
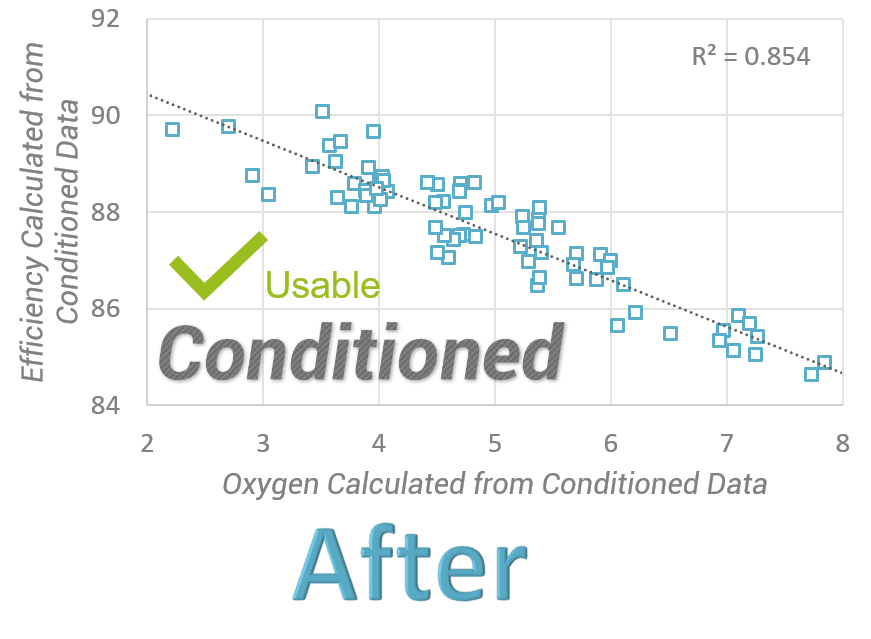
Figure 4 – Estimating excess O2 using conditioned data
The raw input data for this example included: flow rates, temperatures, pressures, laboratory analysis (normal boiling point curve) of the crude, composition of the fuel gas used on the combustion side, and oxygen measurement in the flue gas.
The constraints used on the model were based on combined conservation of mass and energy, including consideration for the combustion reaction of natural gas and thermodynamic calculation such as the evaluation of the phase equilibrium of the crude oil at the exit of the furnace where part of the crude is vaporized. The model reflects the relationships among the variables map to the topology and the characteristics of the process under examination.
Considering all these correlations increases the spatial redundancy of the measurements, they provide information for streams that are not directly measured (e.g. crude liquid and vapor flow after the furnace, secondary air for the combustion of natural gas, etc.).
Although this example illustrates a simple and common situation, it clearly shows that the use of digital technology can help operators rethink ways in which to solve problems and improve the outcome of a given process or operation. This is the essence of digital transformation.
This example was later expanded, with the same positive result, by introducing the crude type into the model and further dissecting the data by grade and by run.
Recommended best practices
The implement a successful data conditioning approach, one should consider the following criteria:
- Assess the data quality of the initial dataset and implement RTDV, RTDR and RTDA as required on new data being generated. Depending on the data defects, historical data can be reprocessed or filtered out of the analysis;
- Maximize raw data input coming from sensors so the data conditioning process can run uninterrupted and autonomously at the desired frequency;
- Introduce additional data references into the model which can infer pseudo measurement that would otherwise not be measurable. In the example case shown in this article, equations of state were used to estimate the enthalpies and vapor/liquid fractions.
If you are uncertain about the state of data quality in your PI System, we sugest you appply Tom Redmans's Friday Afternoon Measurement on the last 100 tags created in your PI System, looking back to 1 week of data[6].
Indirect benefits
The use of models, combined with statistics and numerical analysis results, generates data-quality KPIs which can be used as follows:
- Estimate the overall data quality of a given run (iteration) and establish criteria to accept or reject the dataset;
- Trend the dataset quality results to detect drift and additional factors external to the dataset which may influence the overall data quality;
- Gain insight into how individual data elements impact the overall data quality, and take corrective actions and/or prescriptive actions to prevent future data defects;
- Evaluate the improvement of a given measurement system by simulating the placement of meters and/or the addition of meters.
This important side benefit of data conditioning brings sustainability and actionability to maintain data quality and continues to serve the digital transformation mandates.
Conclusion
Data quality can make or break a digital transformation initiative. The ability to engineer data for digital transformation by using a systematic and objective-driven data conditioning approach requires some level of forethought. It is a tedious task with numerous challenges. It requires breakthrough thinking to build models that perform well. However, adopters of this approach are rewarded on many fronts:
- Using model-based data conditioning can make all the difference in digital transformation initiatives (e.g. Furnace example)
- Building a model digitalizes knowledge, which preserves it and enables its reuse at a low marginal cost – the monetization of digital assets;
- The approach is self-sustainable because it generates data-quality KPIs, enabling a feedback loop to sustain and improve data quality over time. Improvements in data quality will further benefit the digital transformation initiative;
- The tedious, repetitive tasks are relegated to computer and software, allowing the process and data specialists (data engineers, data scientists) to focus on improving the overall performance of the process.
Conditioning data for digital transformation is a way to repurpose known data validation and data reconciliation technologies to solve a new set of problems. It is, in its own right, a digital transformation.
-0-0-0-0-0-
N.B. This Insight was first presented at the ISA Process Industry Conference in November 2019, Houston (TX), USA by Bernard Morneau.
ABBREVIATIONS
[a] Distributed Control System
[b] OLE (object linking and embedding) for Process Control.
[c] Although data and information in the process industries are generally better structured than data related to human behavior and social phenomena, I use the term “Big Data” because it meets the criteria of quantity, velocity and variety normally associated with its definition. However, I would put data and events generated by sensors in the process industries in a class of their own.
[d] Unit of Measurement
[e] Process Flow Diagram
[f] Each data point in this example represents 30 minutes of operations and was calculated using Sigmafine®
REFERENCES
[1] The world’s most valuable resource is no longer oil, but data, The Economist, May 6, 2017
[2] White Paper, Digital Transformation Initiative – Oil & Gas Industry, World Economic Forum, 2017, Figure 3.
[3] Laney, D (2018), “Infonomics”, New York (NY), Bibliomotion Inc
[4] Lynggaard-Jensen, A et al. (2012), Real time data validation. Methodology, guidelines, comments, examples of application and prototype software tool for online (RTC) data validation, European Seventh Framework Program.
[5] Mah, R. (1990), Chemical process Structures and Information Flow, Stoneham (MA), Butterworth Publishers (Chapter 9)
[6] https://www.youtube.com/watch?v=X8iacfMX1nw.